Home Depot, Inc., (HD) is a company that is engaged in the sale of building materials and home improvement products. Its products include building materials, home improvement products, lawn and garden products, and decor products.
While the stock markets have underperformed, this stock has not been an exception; in fact, it has relatively underperformed the broader S&P500 Index.
If we look on a YTD basis, the SPX has lost 20.33%, while HD has lost close to a third of its value, i.e., 33.70%. However, moving on from here, there is technical evidence on the charts that suggests that the stock might have put its potential bottom in place, and perhaps this is the time that one can start accumulating the stock on each decline.

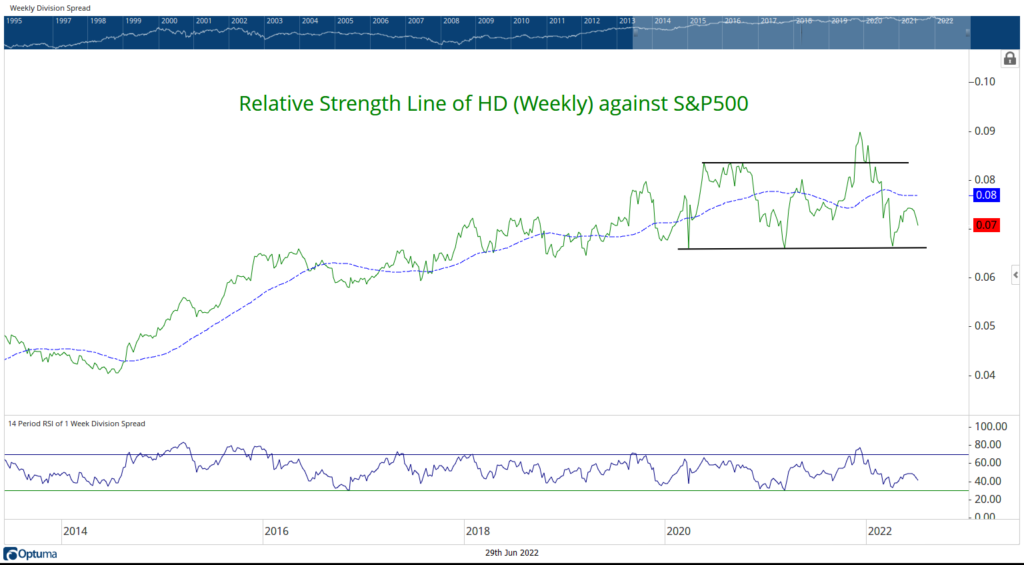
The above is the Relative Strength chart on a weekly time frame of HD against the broader S&P500 index. While the RS line has remained in a broad uptrend over the years, the last two years have been particularly sideways and offer no immediate cue for the near future. However, there is a distinct improvement in the relative momentum and strength of this stock over the past several weeks.

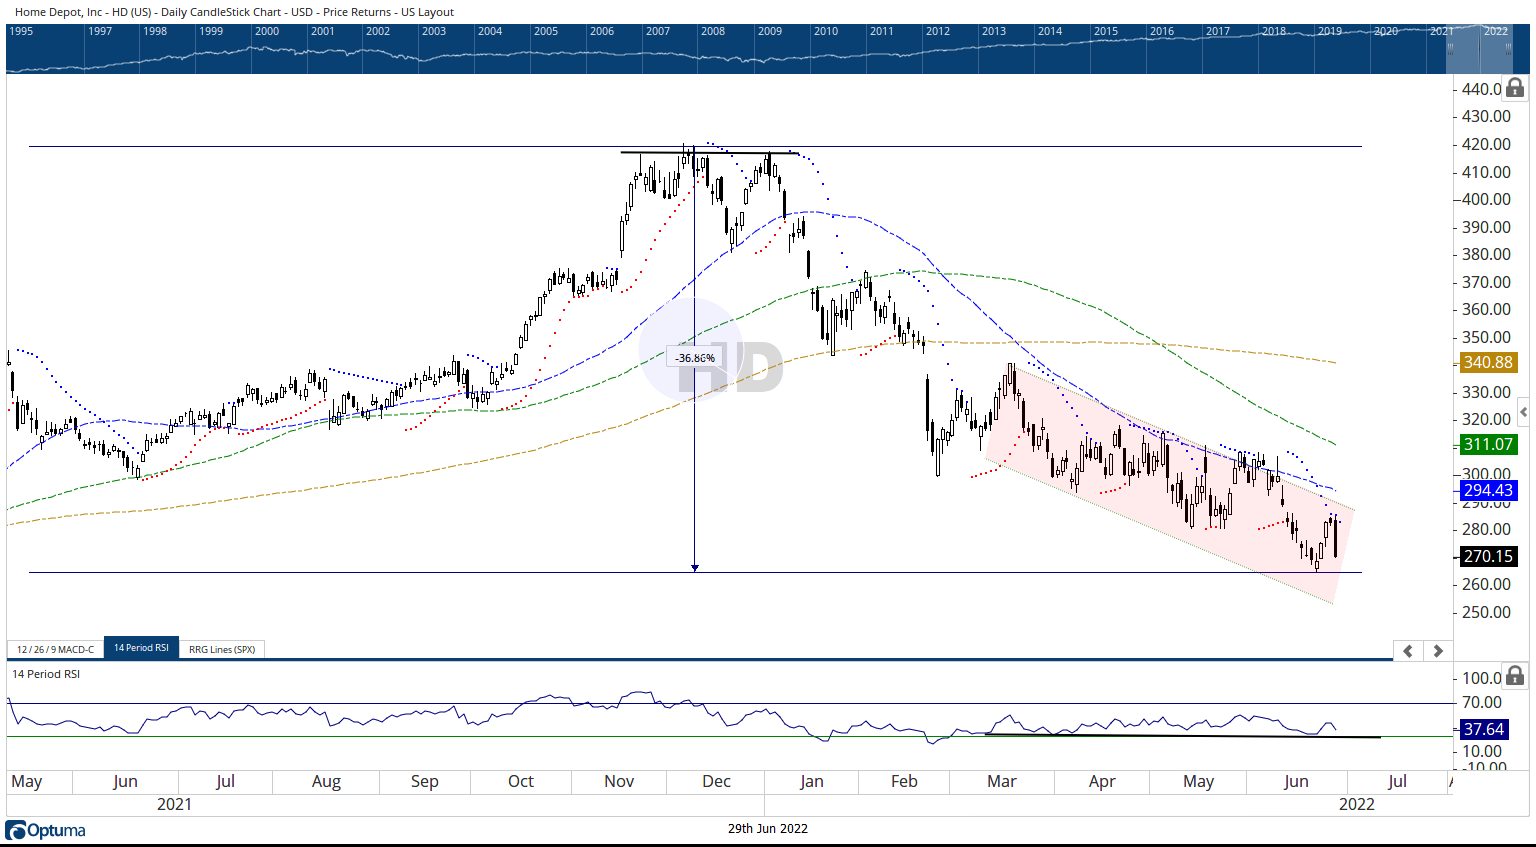
The one shown above is the daily chart of HD. It is predominantly evident that following the price peaks formed near 420 levels towards the end of 2021, the stock has lost close to 36% from its peak when it tested its most recent lows near 260 levels.
While it trades below all its key daily moving averages, what catches the eye is that the stock remains in a falling channel for the last four months. However, all during these four months, although the price has continued to make a lower bottom, the RSI has never gotten oversold and it has also not made any lower bottoms. This has resulted in a very strong bullish divergence of the RSI against the price.

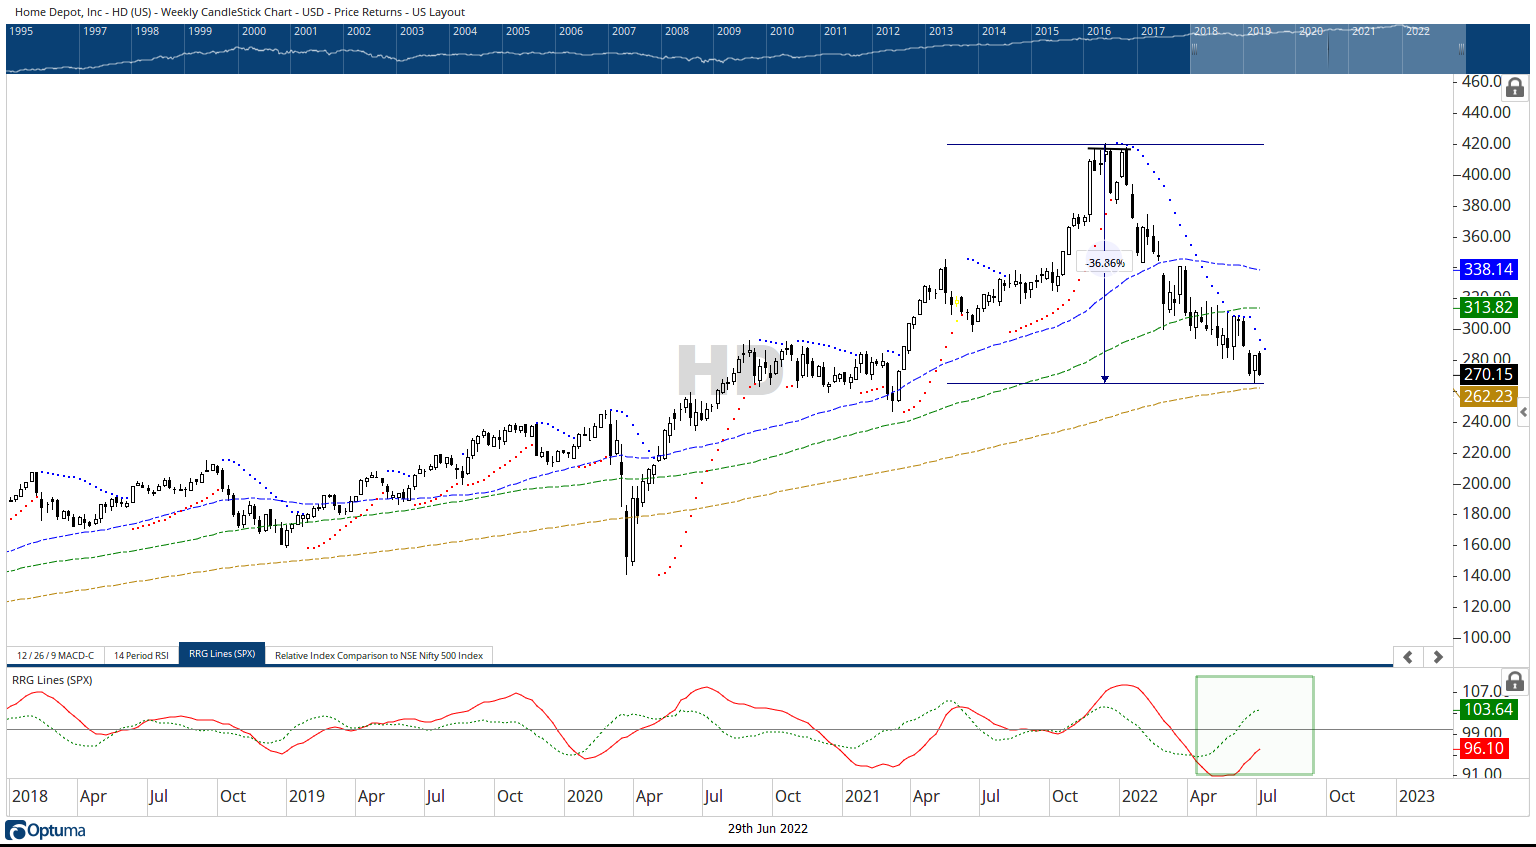
As we look at the higher time frame Weekly charts, they show even more promise of a potential bottom being in place. The most recent price action shows that the stock is near a very important double bottom support which exists in the 255-275 range.
Besides this, the stock has moved inside the improving quadrant of the RRG. This means that it is strongly improving its relative momentum against the broader markets and its phase of relative underperformance has perhaps ended.
It is also equally important from a technical perspective to note that the bullish divergence of the RSI that was seen on the daily time frame charts is also visible on the higher time frame, i.e., weekly charts. This makes this bullish divergence more potent in nature.
Above all, the stock also stares at important support in form of its 200-DMA on a closing basis. The 200-DMA presently stands at 262.
If the present technical structure on the chart resolves on the expected lines, then the stock may see some technical pullback and may make a strong attempt to put a bottom in place. If the technical pullback occurs on the expected lines, the stock may test 325 and 340 levels going ahead from here. Any close below 240 will negate this view.
Milan Vaishnav, CMT, MSTA,
Technical Analyst,
Member: (CMT Association, USA | CSTA, Canada | STA, UK) | (Research Analyst, SEBI Reg. No. INH000003341)
© 2021 ChartWizard FZE | All rights reserved.