The calendar year 2022 has been quite unkind to stock markets globally. Nearly all major global markets peaked in the last quarter of 2021; since then, they have been in corrective decline. The US Dollar has been strengthening and the central banks world over has been in the process of raising interest rates while they grapple with inflation.
The geopolitical tensions between Russia and Ukraine played their own part; crude oil went on to go very near to its high point. The S&P500 index has declined 18.66% on a YTD basis. The Dow Jones Industrial Index and the Nasdaq returned negative returns of 14.55% and 28.28% on a YTD basis. Technology stocks have been one of the biggest hit stocks in the universe.
Having said this, while the markets scramble to find their feet amid the current chaos, there are a few pockets where relative outperformance is seen emerging; such stocks may provide a good entry opportunity given their current corrective decline and consolidation. One such stock is VISA (Symbol: V). One of the Dow 30 constituents, the stock is showing a good base and a potential beginning of its relative outperformance against the broader markets. Even on a YTD basis, VISA has outperformed the DOW as well as the broader S&P500 Index by losing just 10.87%.

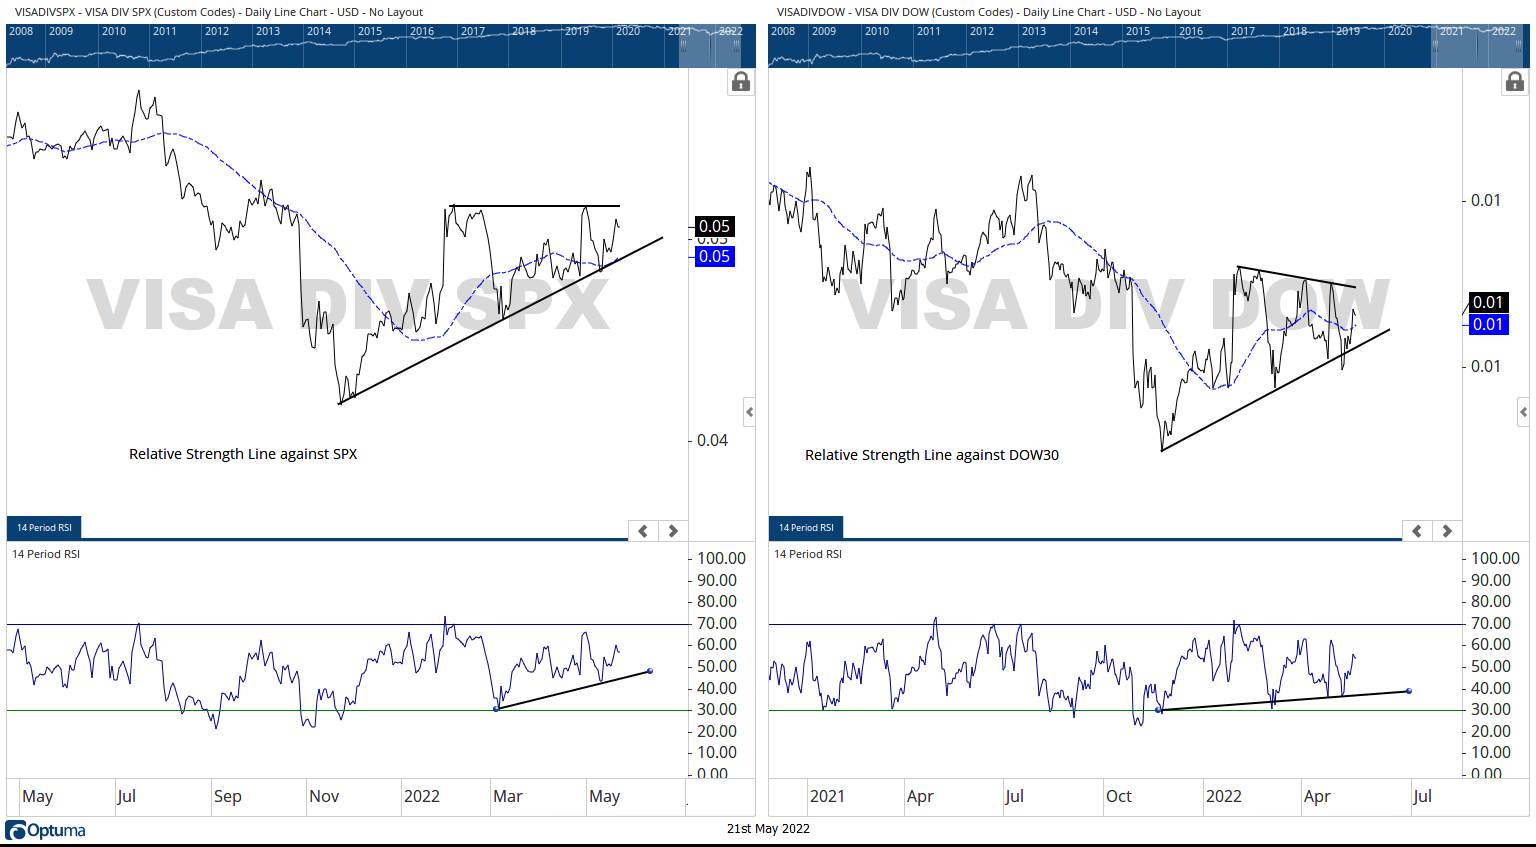
The above chart is the Relative Strength Line of VISA against both Dow and the broader S&P500 Index. It is evident from the above chart that the stock has started to improve its relative performance against both these key indices. We are comparing it with the S&P500 index as that is a broad market index; the comparison against DJI is done as the stock is one of the 30 stocks that make up the Dow.
Though the stock has outperformed the DJI and SPX on a YTD basis, it is started to better its relative outperformance against both these key indexes since the month of November 2021. From November, the RS line against both these key indexes has reversed its trajectory. It is presently rising and has crossed above the 50-DMA.

The above chart which is on a daily timeframe shows VISA taking almost a triple bottom support; the middle bottom is although a minor violation. The stock has traded in a defined trading range of 190-220, and each time, it has taken support at the lower levels.
The RSI is neutral and does not show any divergence against the price. The daily MACD shows that the histogram is sharply narrowing; we may see a positive crossover of this indicator any time soon.
Importantly, the stock is inside the leading quadrant of the RRG on both the time frames when benchmarked against the broader S&P500 index.

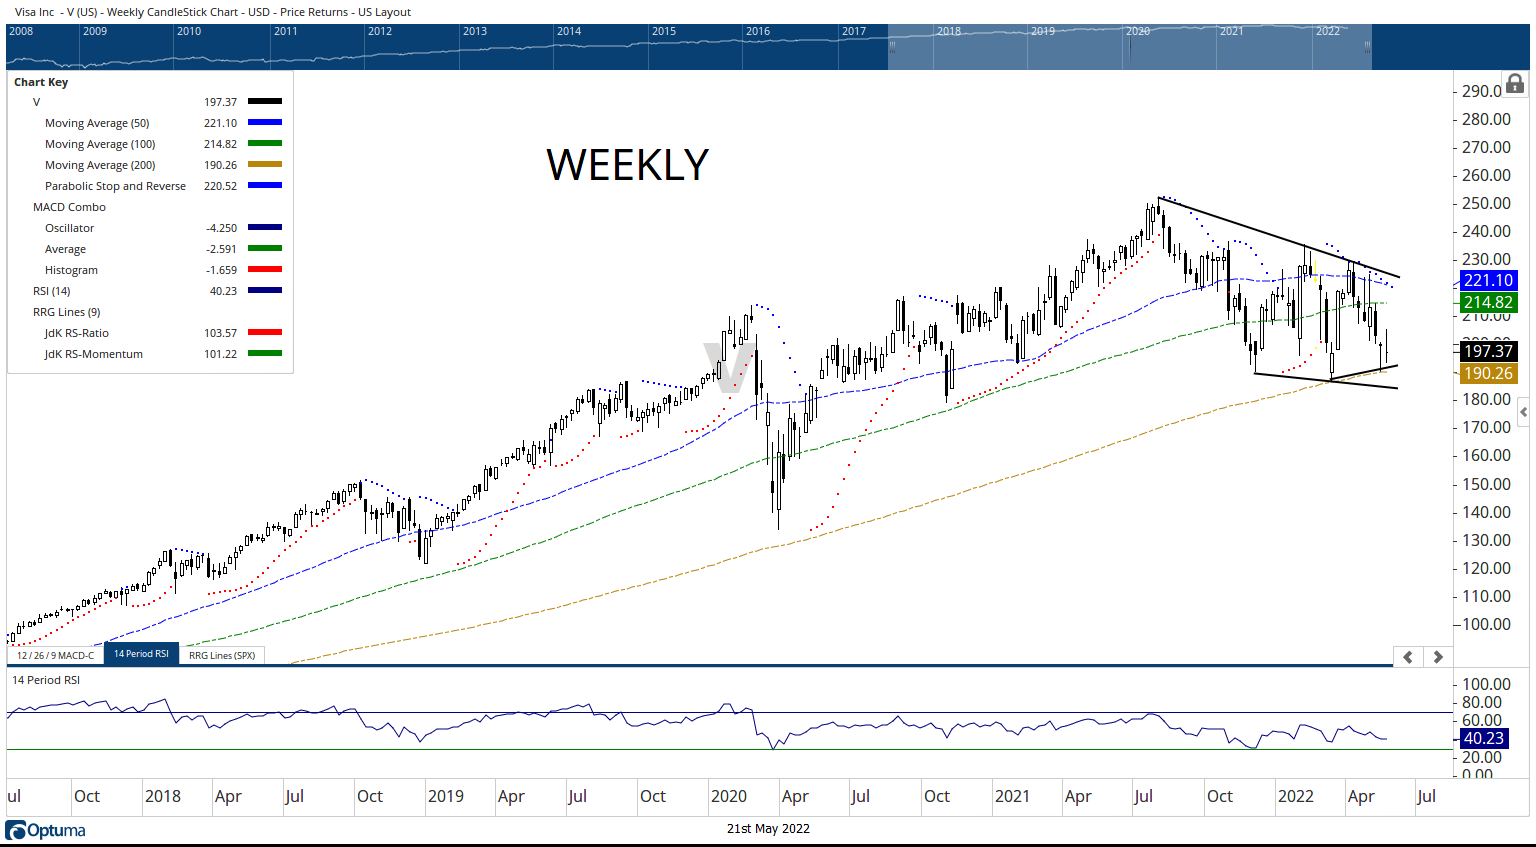
The weekly chart shows that stock is testing the key support area of 200-Week MA. The 200-Week MA is presently at 190.26 and the stock has tested this level more than once, only to bounce back after testing it.
The most recent price actions show that the stock formed a hammer (a candle with a long lower shadow) in the week before this one; its occurrence near the key support area of 200-DMA hints at a potential bottom formation subject to confirmation. The formation of a Doji this week shows another strong attempt by the stock to hold and validate this key support level.
The stock is expected to post relatively strong performance against the key indexes. If the present technical setup resolves on the expected lines, it may test 226-232 levels in the near term. VISA is currently poised at a good entry point from the medium-term horizon; it can be added/accumulated with each incremental decline if any.
Milan Vaishnav, CMT, MSTA,
Technical Analyst,
Member: (CMT Association, USA | CSTA, Canada | STA, UK) | (Research Analyst, SEBI Reg. No. INH000003341)
© 2021 ChartWizard FZE | All rights reserved.