Ralph Lauren Corp. (Symbol: RL) has been consolidating in a broad range on the weekly charts. While the equity markets were strong and rising, the stock remained aloof and did not participate in any directional volatility, and remained in its own trajectory.
Towards the end of 2020, the stock staged a very strong breakout from a Symmetrical Triangle Formation. The stock had consolidated in between 75-90 zone and staged a strong reversal from a symmetrical triangle. The breakout took the stock from 77.41 to 142 by May 2021. After the price levels of 142 were tested, Ralph Lauren (Symbol: RL) has stayed in a broadly defined consolidation range. During this consolidation process, the stock has made a minor double bottom near 103 and a lower top at 125 levels.
At present, the stock remains in this consolidation zone; it also trades above all its key moving averages (50-, 100-, and 200-Week Moving Averages).
Few strong signals have emerged that hint towards a potential breakout in this stock.
The weekly MACD has shown a positive crossover; it is now bullish and stays above the signal line. RSI is a lead indicator and can also be subjected to pattern analysis just like the price. When this indicator is seen from this angle, it also appears to have broken out by penetrating the falling trend line. It has also marked a new 14-period high which is a bullish sign.

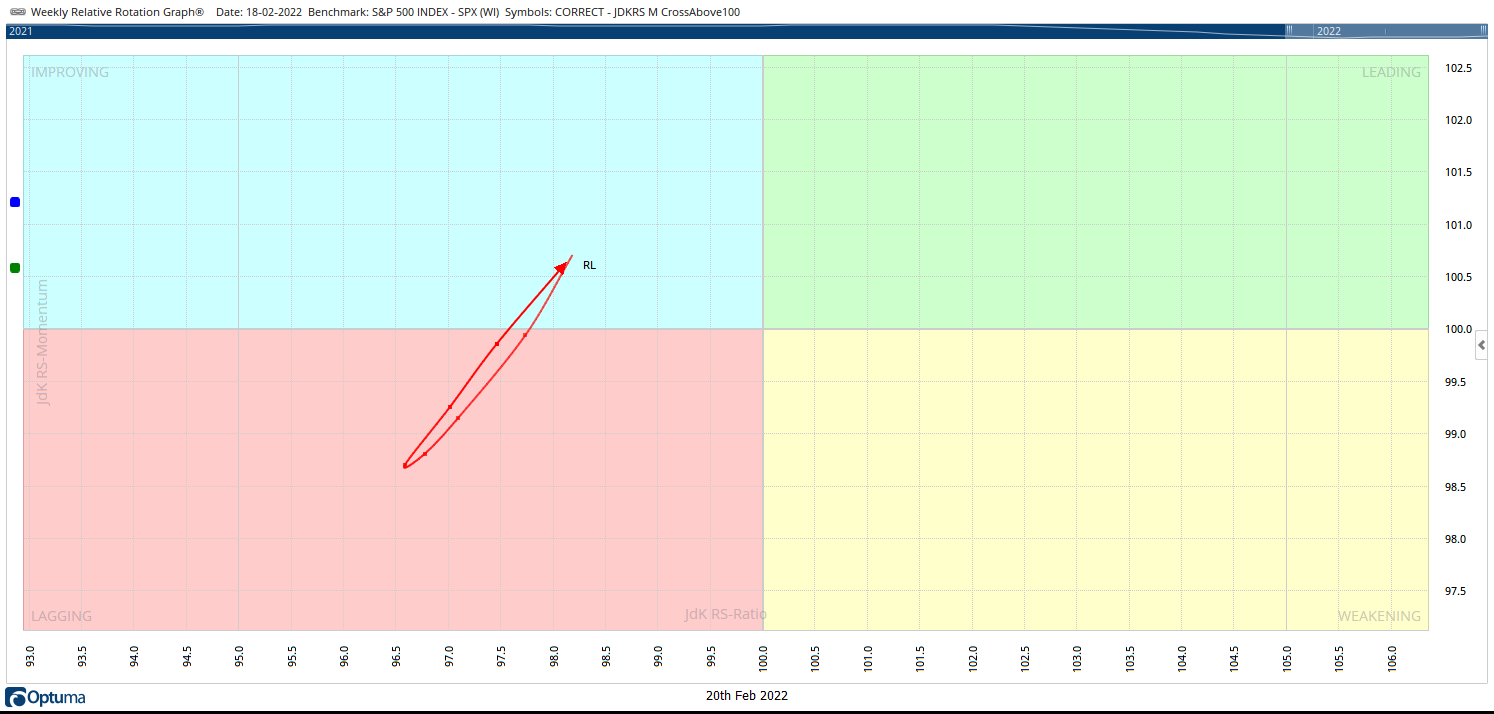
The above chart has Ralph Lauren stock (Symbol: RL) plotted on the Relative Rotation Graph (RRG) benchmarked against the broad market index, S&p500.
It appears that following a strong improvement in the relative momentum against the benchmark, the stock has rolled inside the improving quadrant of the RRG. This means that the relative underperformance of this stock against the broader markets has potentially ended and there are strong possibilities that a period of relative outperformance of this stock may begin.
The RS Line against the broader S&P500 Index has started to rise; it has crossed above its 50-period MA. The stock also remains in a continuing PSAR buy signal.
On-Balance-Volume (OBV) is considered the granddaddy of volume indicators. The OBV has marked a new high ahead of the actual price breakout; this is a strong and bullish confirmation on the volume front.
If the present pattern resolves on the expected lines, the stock may test 170-182 levels; a potential 38% from the current levels. Any close below 102 will negate this view.
Milan Vaishnav, CMT, MSTA,
Technical Analyst,
Member: (CMT Association, USA | CSTA, Canada | STA, UK) | (Research Analyst, SEBI Reg. No. INH000003341)
© 2021 ChartWizard FZE | All rights reserved.