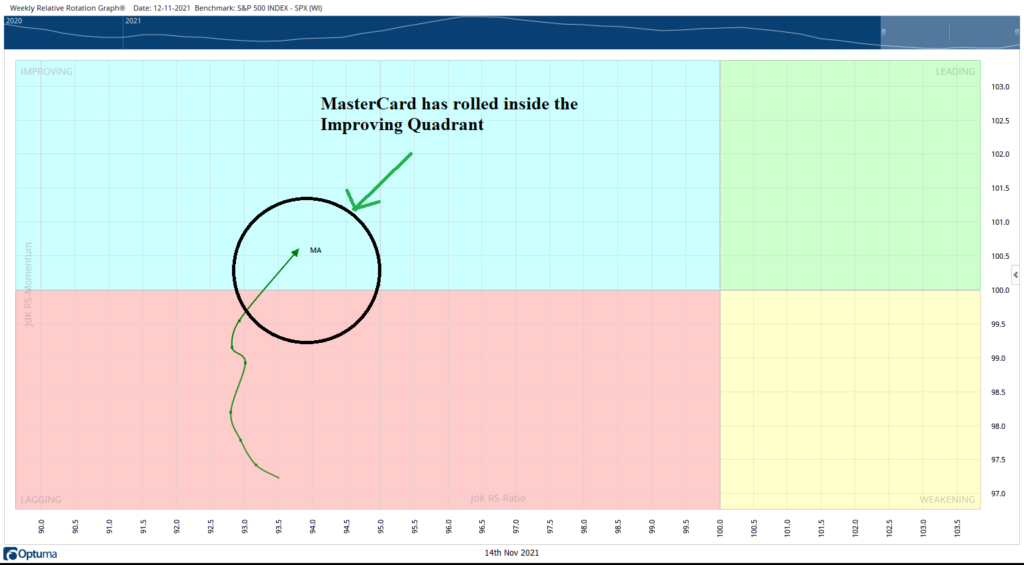
MasterCard – After testing the levels of 347.25 in February 2020, this stock hasn’t really made any significant moves. Of course, it has managed to mark incremental gains, but those gains have been given up much sooner than they were made. Broadly speaking, MasterCard (MA) has continued to broadly underperform the S&P500 Index on relative terms. Some very encouraging signs have emerged which hint at a likely resumption of the up -move and some upward revision of prices over the coming week.
As of the week ending Friday, November 12th, MA has rolled inside the improving quadrant of the Relative Rotation Graph (RRG) when benchmarked against the broader S&P500 Index. This has a technical significance. Rolling side the improving quadrant means a likely end of relative underperformance of this stock against the broad market index.
There are other encouraging pieces of evidence present on the price chart which support this view.

Relative Strength Index (RSI) is a lead indicator; this means that signs, bullish or bearish, appear on this indicator ahead of the price. This indicator measures the movement of the stock/index against its own self, usually over a period of 14-days, by default.
In MasterCard’s case, RSI has shown a strong bullish divergence against the price. As evident from the chart, while the price of the stock made lower bottoms, the RSI did not. This resulted in a bullish divergence. Subject to final price confirmation on the charts, this may lead to some upward revision in prices.

The price pattern analysis shows that after marking a high point near 401.50 and a subsequent resistance at 395.25, the stock witnessed a corrective retracement. It slipped below the 50-Week MA which is presently at 358.68 but managed to take support at the 100-Week MA which stands at 332.36.
A Piercing Line appeared on the candle; the occurrence of such a candle near the support area of 100-Week formed a potential base for the stock. Following a pullback from this potential base and support, the stock has managed to close above the 50-Week MA as well.
The weekly MACD is bearish and remains below its signal line. However, the narrowing Histogram indicates that downside momentum is decreasing; this may lead to the positive crossover of the MACD over the coming weeks.
What does the present technical setup mean?
The present technical setup indicates that there are greater possibilities of the stock price staging an up move. If the present pattern resolves on the expected lines, we can see the stock testing the levels of 400 and 430 over the coming weeks.
Importantly, this reading will stand negated if the stock slips and closes below 324 levels.
Milan Vaishnav, CMT, MSTA,
Technical Analyst,
Member: (CMT Association, USA | CSTA, Canada | STA, UK) | (Research Analyst, SEBI Reg. No. INH000003341)
© 2021 ChartWizard FZE | All rights reserved.